Resolution Rate vs Deflection Rate vs Containment Rate: How to Read AI Support Metrics
Three vendors can describe the same AI agent as 80% contained, 65% deflected, and 45% resolved. This guide decodes containment, deflection, and resolution rate, shows why the numbers diverge, and gives you a checklist for getting the real figure before you buy.
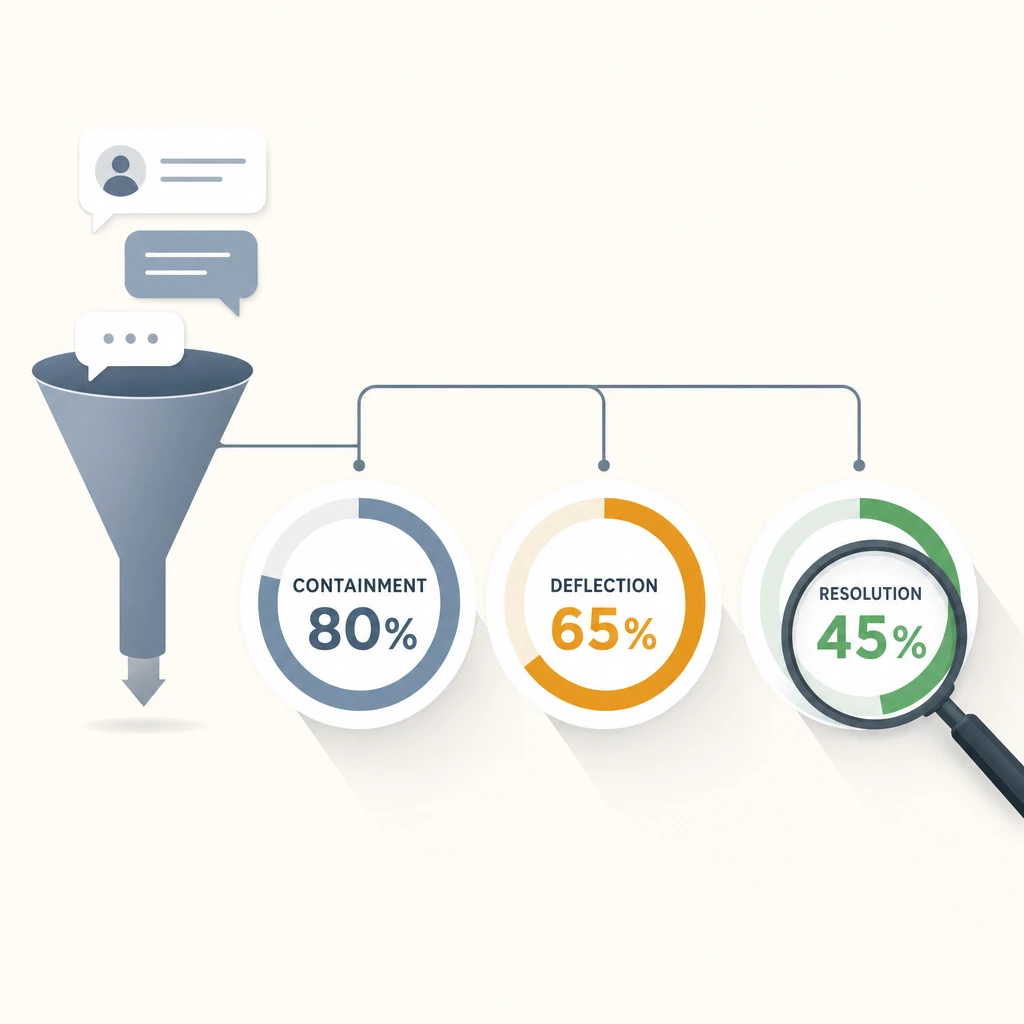
Three different AI support vendors can describe the exact same agent as “80% contained,” “65% deflected,” and “45% resolved” — and all three can be telling the truth. The numbers diverge because they count different events, and the one that matters to your customers is almost always the smallest of the three.
In 2026 every support vendor leads with an automation percentage, and the percentages keep climbing in the marketing while staying stubbornly lower in production. The fix is not to find the “honest” vendor. It is to learn what each metric actually measures so you can convert any headline into the number you care about: how many customers got their problem solved. This guide decodes containment, deflection, and resolution rate, shows exactly why they split apart, and gives you the questions that pull the real figure out of a sales deck.
The three metrics, in plain terms
These three words get used interchangeably on pricing pages and in demos. They are not interchangeable. Each starts counting at a different point and stops at a different point.
Containment rate is a channel metric. It asks: of the conversations that entered this automated channel, how many ended inside it without being passed to a human? Decagon’s definition is “the percentage of customer interactions that enter an automated channel and are fully resolved within that channel without being escalated,” with the formula contained sessions ÷ total sessions entering the channel × 100. (Decagon) The catch is in the word “resolved.” A session where the customer gave up and closed the window also never escalated, so a loose containment count scores the abandon as a win.
Deflection rate is a cross-channel metric. It asks: of all the support contacts that could have reached a human, how many were handled without one? If 1,000 people start a support interaction across chat, email, and your help center, and 650 get an answer without a ticket reaching an agent, deflection is 65%. Deflection is broader than containment because it spans every channel, not just the bot.
Resolution rate is an outcome metric. It asks: of the issues the AI handled, how many were actually solved end to end? Zendesk defines it as “the percentage of customer or employee issues an AI system fully resolves end-to-end without human intervention,” where “the customer’s problem is completely handled — any required action is taken, the answer is accurate, and no follow-up or escalation is needed.” The formula is issues fully resolved by AI ÷ total issues handled × 100. (Zendesk)
The difference is the whole game. As Zendesk puts it directly: “AI resolution rate measures the percentage of issues fully solved by AI, while deflection rate counts interactions handled without human involvement — even if the problem remains unresolved.” A timeout, an abandon, and a confidently wrong answer all count toward containment and deflection. None of them count toward resolution.
| Metric | The question it answers | What inflates it |
|---|---|---|
| Containment | Did the conversation stay in the bot channel? | Abandons and timeouts never “escalated,” so they score as contained |
| Deflection | Did the contact avoid a human, anywhere? | A dodged “try our help center” reply counts even if nothing was solved |
| Resolution | Was the customer’s issue actually fixed? | Hard to inflate — it needs a confirmation signal, so it is the honest one |
Why one deployment produces three numbers
Walk a single month through all three definitions and the spread becomes obvious. The numbers below are an illustration to show the mechanics, not a benchmark to copy.
Say 1,000 customers open the chat widget. Of those, 800 finish inside the widget without being handed to a human — 200 escalated. Containment looks like 80%.
But your support also takes email and social, and the total support demand that month was higher. Counting every contact across channels, 650 were handled without a human ever touching them. Deflection is 65% — lower, because the denominator now includes contacts the bot never saw and channels where people went straight to a person.
Now audit what actually got solved. Of the AI-handled conversations, some were abandons, some were the bot looping, some were “I can’t help with that” dead ends, and some were confident answers that turned out to be wrong. When you require a real resolution signal — an explicit confirmation, a completed action, or no repeat contact in a set window — only 450 issues clear the bar. Resolution is 45%.
Same agent. Same month. 80% / 65% / 45%. A vendor that wants a big number quotes containment. A vendor that wants an honest one quotes resolution. Neither is lying. They are answering different questions, and only the last one maps to a customer who walked away helped.
This is why containment in particular needs correction before you trust it. The cleanest fix is a re-contact check: if a “contained” session is followed by a new contact about the same issue within 24 hours, reclassify it as unresolved. Without that adjustment, containment can read 5 to 15 points higher than reality. (Decagon)
The benchmark numbers, and why to distrust most of them
Published benchmarks are inconsistent, frequently self-reported, and rarely define their terms the same way, so treat any single percentage as a starting point for questions rather than an answer.
With that caveat, the most-cited containment ranges put best-in-class AI deployments at 70–80%, average deployments at 40–55%, and rule-based bots below 35%. (Decagon) Notice those are containment figures — the most inflatable of the three. The equivalent honest-resolution number sits well below the containment headline for the same deployment, because resolution strips out the abandons and dead ends that containment keeps.
The market’s own pricing is the clearest tell that resolution is the number that counts. Intercom prices its Fin agent on outcomes, at $0.99 per resolution, and defines a resolution as the customer’s issue being “fully solved without human intervention.” Intercom frames the model as the vendor carrying the risk: “the vendor should carry risk when the product doesn’t perform.” (Intercom) When a market leader charges per solved problem rather than per dodged ticket, that is a strong signal about which metric reflects real value — and a reason to be skeptical of any pitch that leads with containment instead.
One more reason the benchmarks mislead: the achievable ceiling depends heavily on your question mix. Narrow, repetitive intents — order status, password resets, refund eligibility, shipping windows — automate at a high rate because the same answers recur and are easy to ground. Judgment-heavy or account-specific questions — billing disputes, “is this the right plan for me,” anything mid-incident — automate at a far lower rate and should not be forced. A blended company-wide percentage hides this entirely. Two teams with identical agents can post very different numbers purely because one has a tidier set of questions.
The metric the headline hides: cost and trust
A high automation percentage that comes from dodging rather than solving does not save money — it relocates the work and adds a new bill.
A dead-end answer that “deflects” a ticket often produces a second contact, frequently angrier and in a channel you measure less carefully. The cost did not disappear; it moved and grew. And confident-wrong answers carry a reputational cost that no containment dashboard shows. The current industry conversation reflects this: trade coverage in 2026 has turned to whether human review can even keep up with AI errors at scale, with CX Today running pieces on the limits of oversight against hallucinations. That is the backdrop against which a “90% contained” claim should be read — containment counts the wrong answer as a success.
The practical takeaway is to never read an automation metric alone. Pair any containment or deflection figure with two cross-checks:
- Repeat-contact rate for AI-handled issues. If automation is up but the same customers reappear within a week, the issues were delayed, not resolved.
- CSAT on AI-handled conversations. If the automation percentage rises while satisfaction holds or improves, the gains are real. If satisfaction slips as the number climbs, you are gaming the metric.
Our post-launch metrics scorecard lays out how verified resolution, citation quality, and handoff timing fit together as a connected set rather than one vanity number, and the deflection benchmark guide goes deeper on setting an honest target for your own team.
How to get the real number out of a vendor
You will not change how a vendor markets. You can change what you accept as proof. Before you trust any automation claim, ask these six questions — ideally during a trial run on your own content, not a curated demo.
- Which metric is this — containment, deflection, or resolution? If the answer is vague, assume it is the most flattering one. Ask them to name the formula.
- What is the denominator? Is it sessions that entered the bot, or all support contacts across every channel? A bot-only denominator inflates the rate against a team that counts everything.
- What counts as a resolution? An explicit customer confirmation is strong. “The customer didn’t message again” is weaker but usable. “The session ended” is not a resolution.
- Is there a re-contact window? A figure with no 24-hour (or longer) re-contact check is counting some abandons and delayed problems as wins.
- Does this number split by question type? Ask for the rate on judgment-heavy intents, not just the blended average. The gap between the two tells you where the agent actually helps.
- Can I see it on my data? The only number that matters is the one your agent produces on your real questions during a trial. Everything else is someone else’s question mix.
If a vendor can answer all six cleanly, the headline is probably trustworthy. If they cannot, the percentage on the slide is marketing, and you should run your own measurement before signing anything.
Where Owlish fits
Owlish is our product, so read this section as a vendor being specific rather than neutral.
Owlish is built so the honest number — resolution — is the one you can actually see. The agent answers only from the website, documents, and PDFs you ingest, which keeps replies inside content you control and cuts the confident-wrong answers that inflate containment while hurting customers. (knowledge base overview) You can turn on source citations, so a “resolved” answer is one both the customer and your team can verify rather than take on faith. When the agent should not answer alone, it hands the conversation to a human with the context attached instead of dead-ending the customer — which is the difference between a real resolution and a containment statistic. (human handoff) You deploy it as a web widget where questions actually start, and the pricing is flat and session-based, not metered per resolution, so the bill does not punish you for succeeding. (pricing)
That shape suits small and growing teams that want to automate the repetitive questions safely and measure what they truly resolved. It is a weaker fit if you need a full contact-center suite with telephony, deep ticket routing, and CRM-grade workflows, or if you specifically want outcome-based per-resolution pricing where the vendor carries the volume risk. If that is your requirement, a larger service platform will serve you better and you should pick one of those. Owlish is the grounded AI answering and handoff layer, not the whole helpdesk.
FAQ
What is the difference between deflection rate and resolution rate?
Deflection rate counts support contacts handled without a human, even if the issue was never solved. Resolution rate counts issues the AI actually fixed end to end. A timeout, an abandon, or a confidently wrong answer all raise deflection while leaving resolution flat, so the two numbers can differ by tens of points for the same agent. Always report them together.
What is a good AI containment rate?
Commonly cited ranges put best-in-class AI deployments around 70–80% containment, average ones at 40–55%, and rule-based bots below 35%. But containment is the most inflatable of the three metrics because abandons and timeouts count as “contained.” A containment figure is only meaningful with a re-contact adjustment and a satisfaction cross-check behind it.
Is containment rate the same as resolution rate?
No. Containment measures whether a conversation stayed inside the automated channel. Resolution measures whether the problem was solved. A session can be fully contained and completely unresolved — the customer simply gave up. Treat containment as an upper bound on resolution, never as a substitute for it.
Why do vendors quote different automation numbers for the same product?
Because they choose the metric that flatters the pitch. Containment is usually the highest, deflection sits in the middle, and resolution is the lowest and most honest. None of the three is wrong; they answer different questions. Ask which metric, which denominator, and what counts as a resolution before comparing two vendors’ headline numbers.
How do I verify an AI support vendor’s resolution claim?
Run the agent on your own content during a trial and measure the rate yourself, with a real resolution signal (an explicit confirmation, a completed action, or no repeat contact in a set window) and a re-contact check. Ask the vendor to name the formula, the denominator, and whether the number splits by question type. A claim that survives those questions on your data is trustworthy; one that does not is marketing.
Sources
- Zendesk — What is AI resolution rate and how to measure it: resolution-rate definition, formula, and the deflection-vs-resolution distinction
- Decagon — Chatbot containment rate: containment formula, benchmark ranges, and the 24-hour re-contact adjustment
- Intercom — Building outcome-based pricing for Fin: $0.99-per-resolution outcome pricing and resolution definition
- CX Today: 2026 coverage of AI support governance and the limits of human oversight against hallucinations
Trademark note
Zendesk, Decagon, Intercom, Fin, and other product names mentioned here are trademarks or registered trademarks of their respective owners. Owlish is not affiliated with or endorsed by those companies unless explicitly stated. Metric definitions and figures were checked against the linked public sources in June 2026.
Where to start with Owlish
If you want a resolution number you can defend, start by grounding an agent in your real help content and turning on citations, then measure resolution and repeat-contact alongside any containment or deflection figure. Read the knowledge base overview, see the pricing page for plan details, then walk through building your first agent. Within a week you will know whether your automation is solving problems or just hiding them.